
Dashboard
Multi-site view, roles & permissions, alert management, hosted in Frankfurt.
Four impact fields, nine applications – one platform. Click an application to open the detail text.

“Multi-parameter measurement,– Specification, season 2025
continuously,
autonomous for months.”
Tap a value to learn more
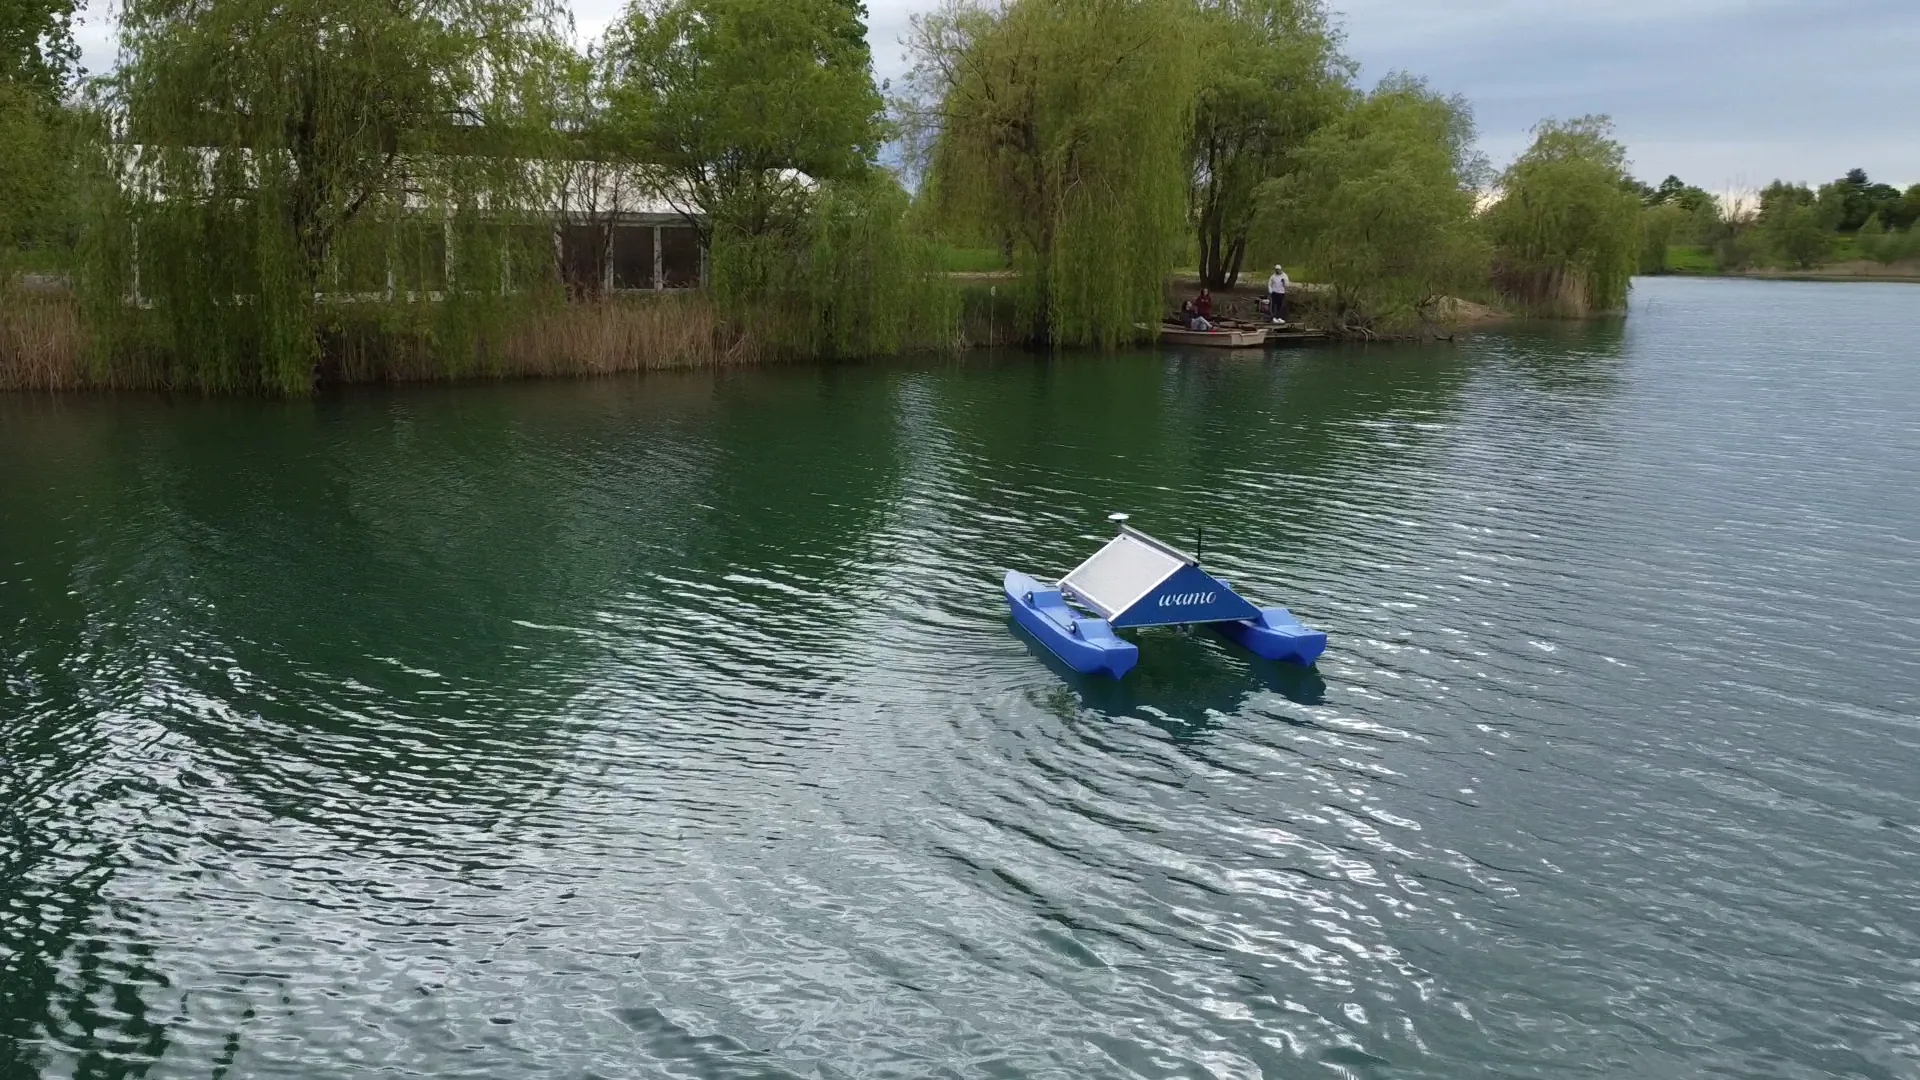
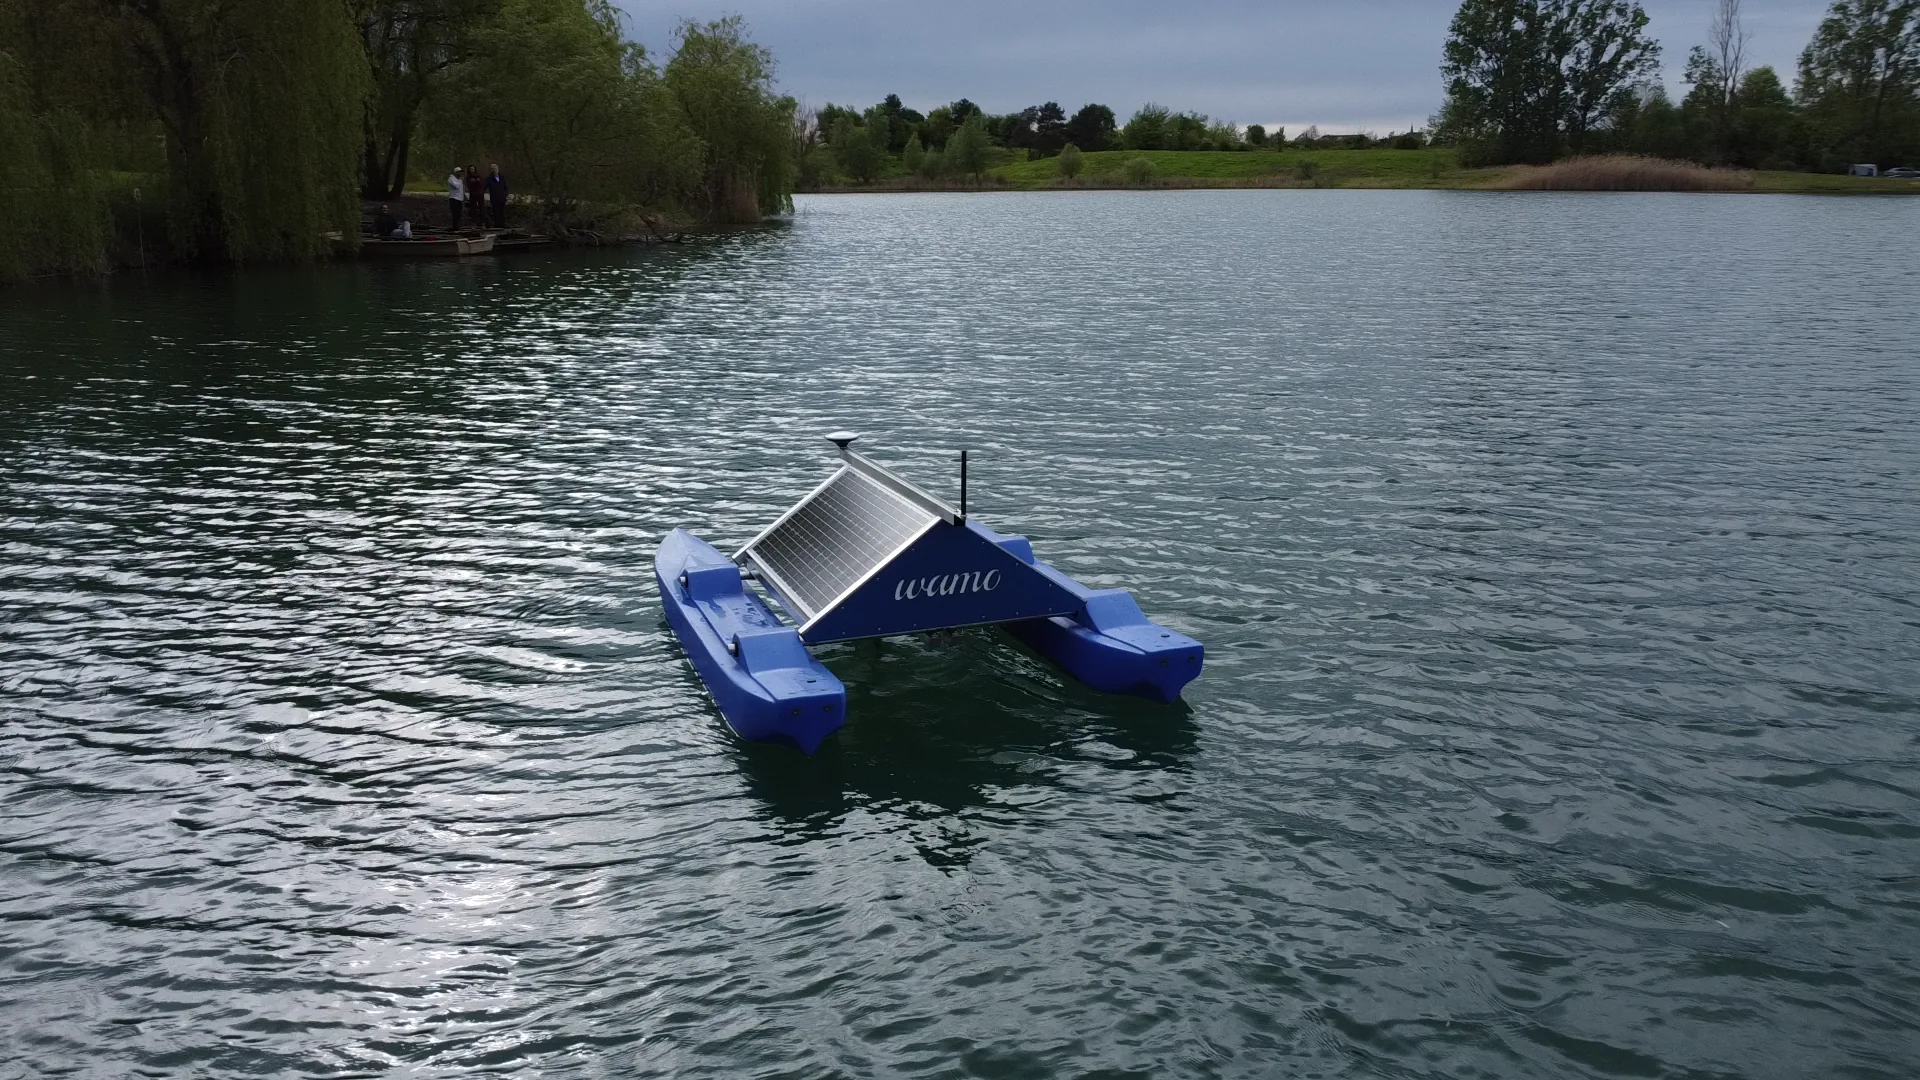
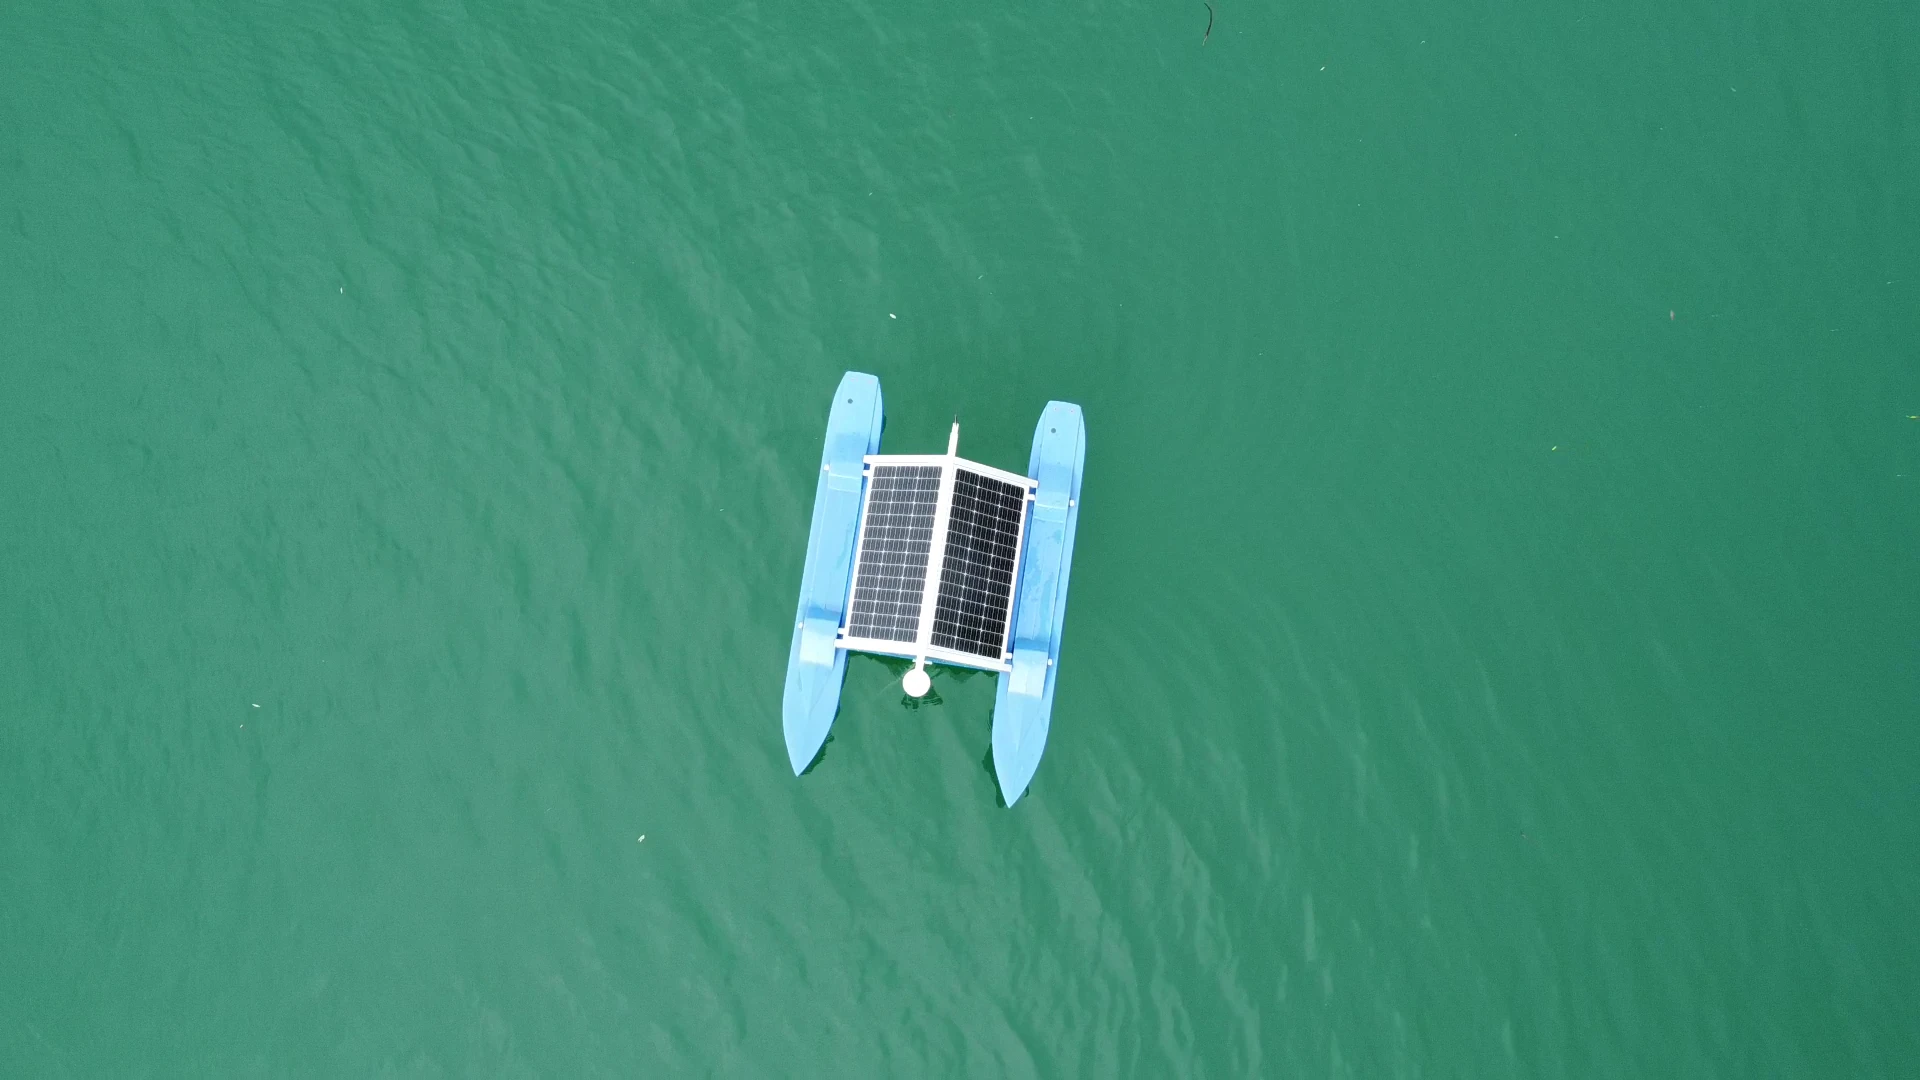
An integrated solar module with a buffer battery powers year-round operation – even at cloudy locations in Central Europe. No grid connection needed, no shore cabling.
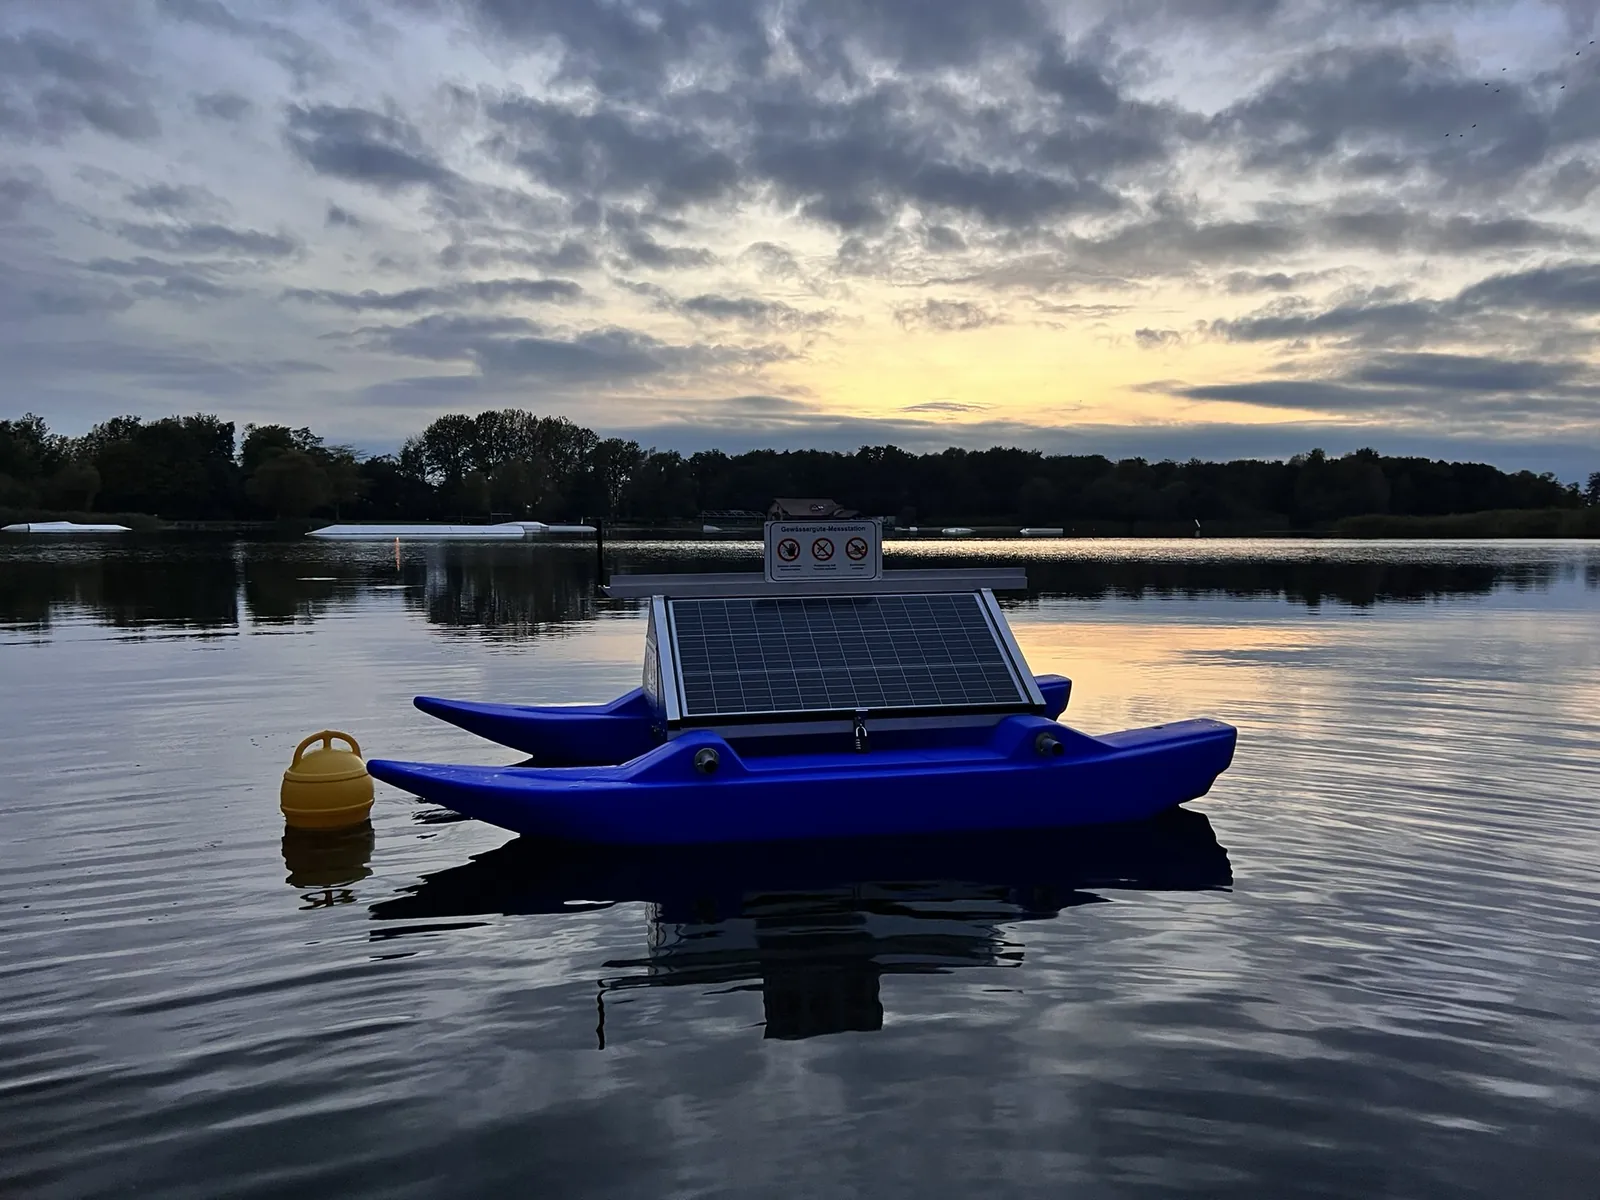
Manufacturer-open: probes from s::can, Endress+Hauser or bbe moldaenke, optionally YSI and OTT, with automatic calibration and bio-fouling protection. Optical, electrochemical and fluorimetric measurement channels in a compact housing.
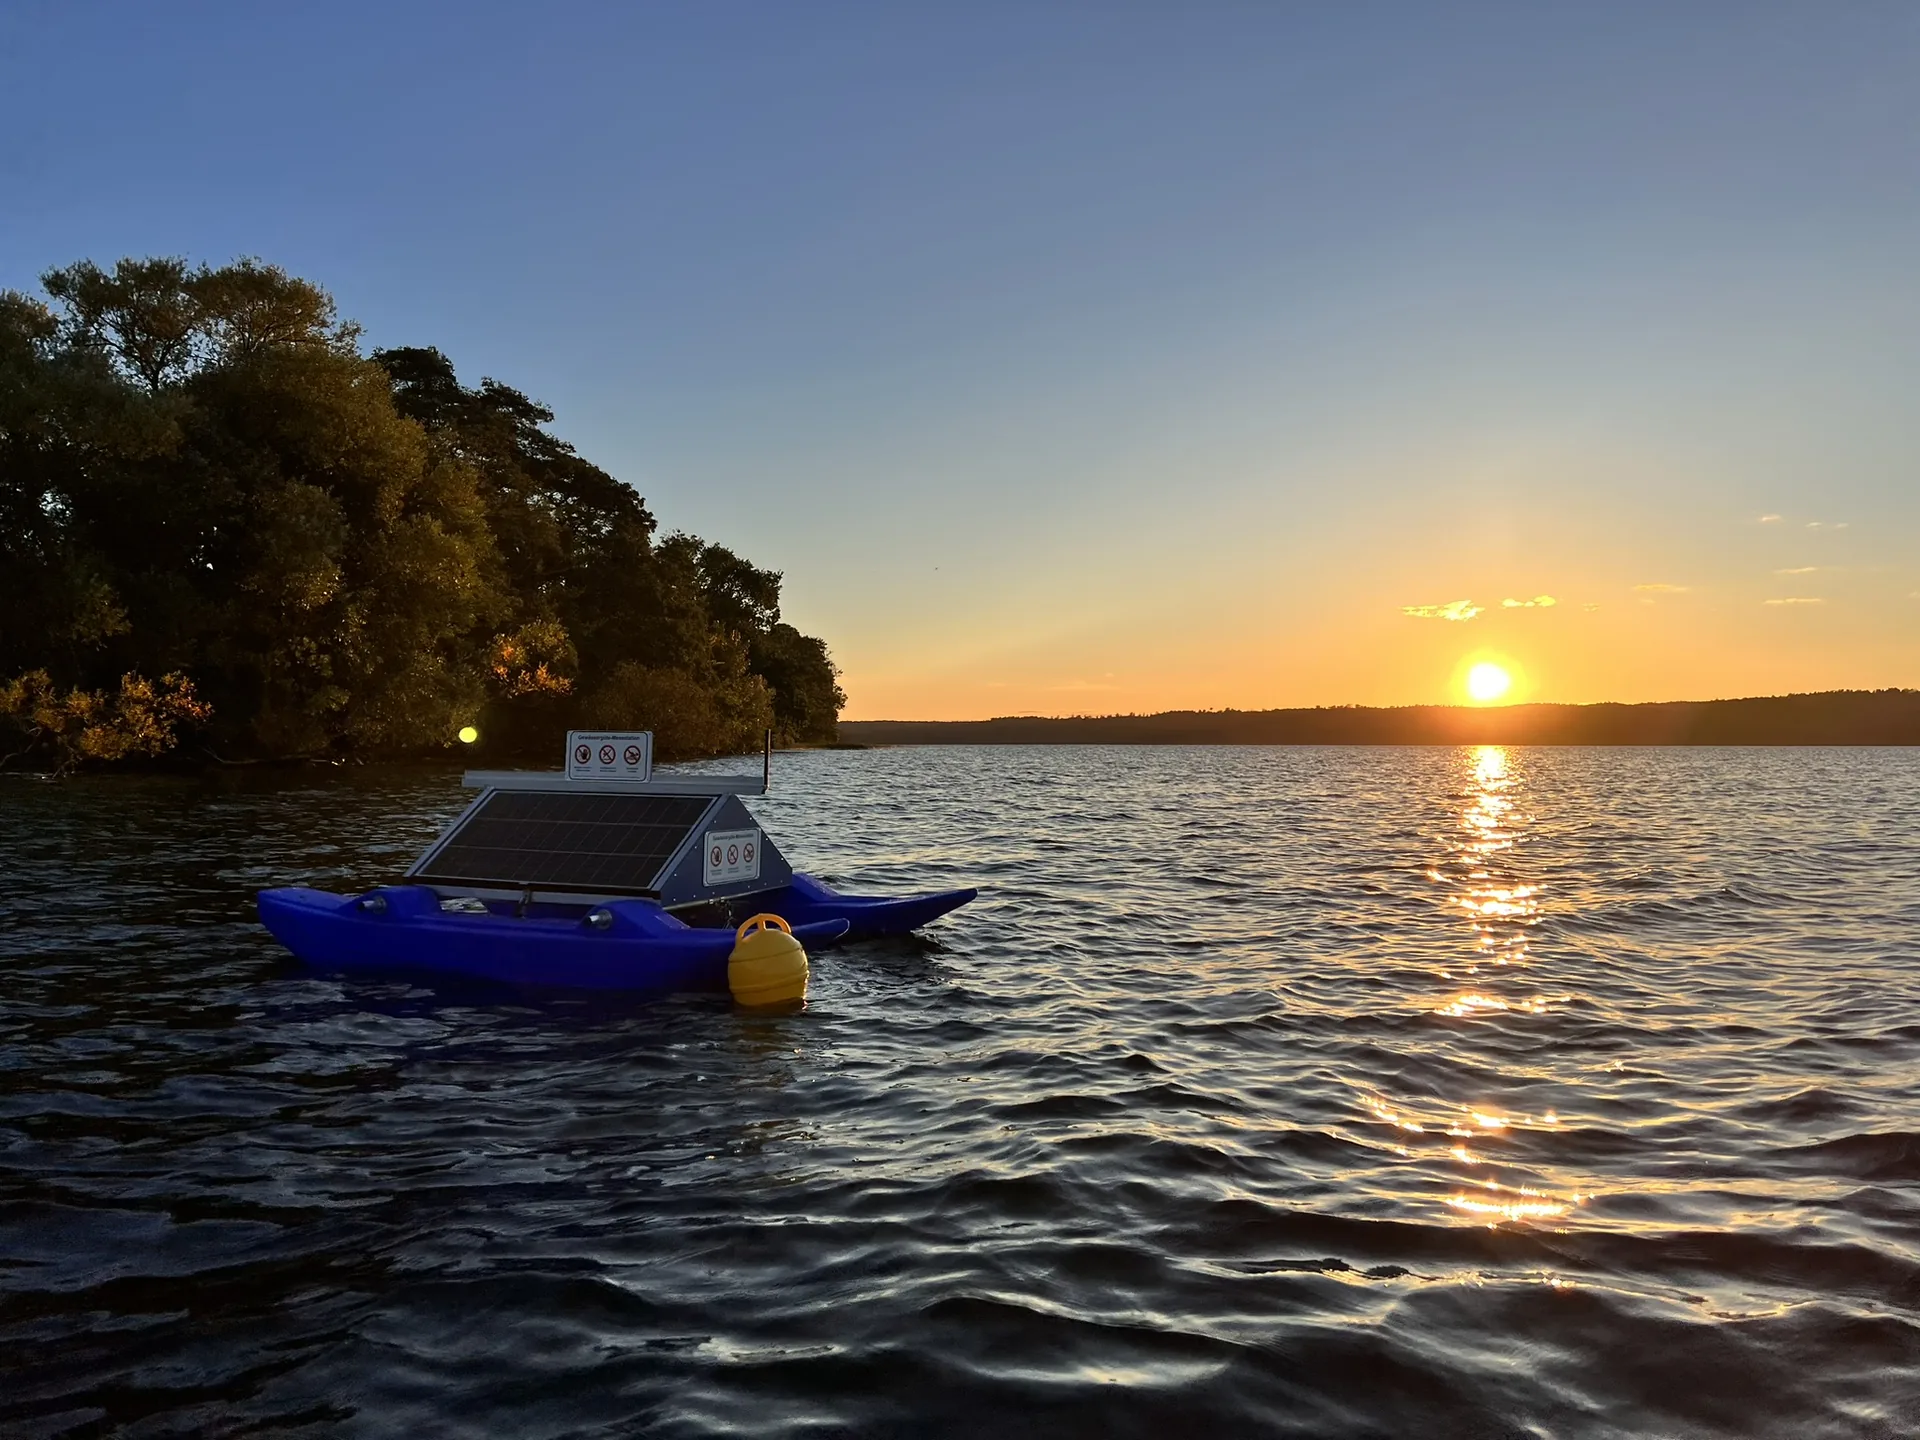
GSM/LTE or LoRaWAN transmit data continuously. Threshold alerts via email and webhook. Raw data export to CSV, JSON or via public API.
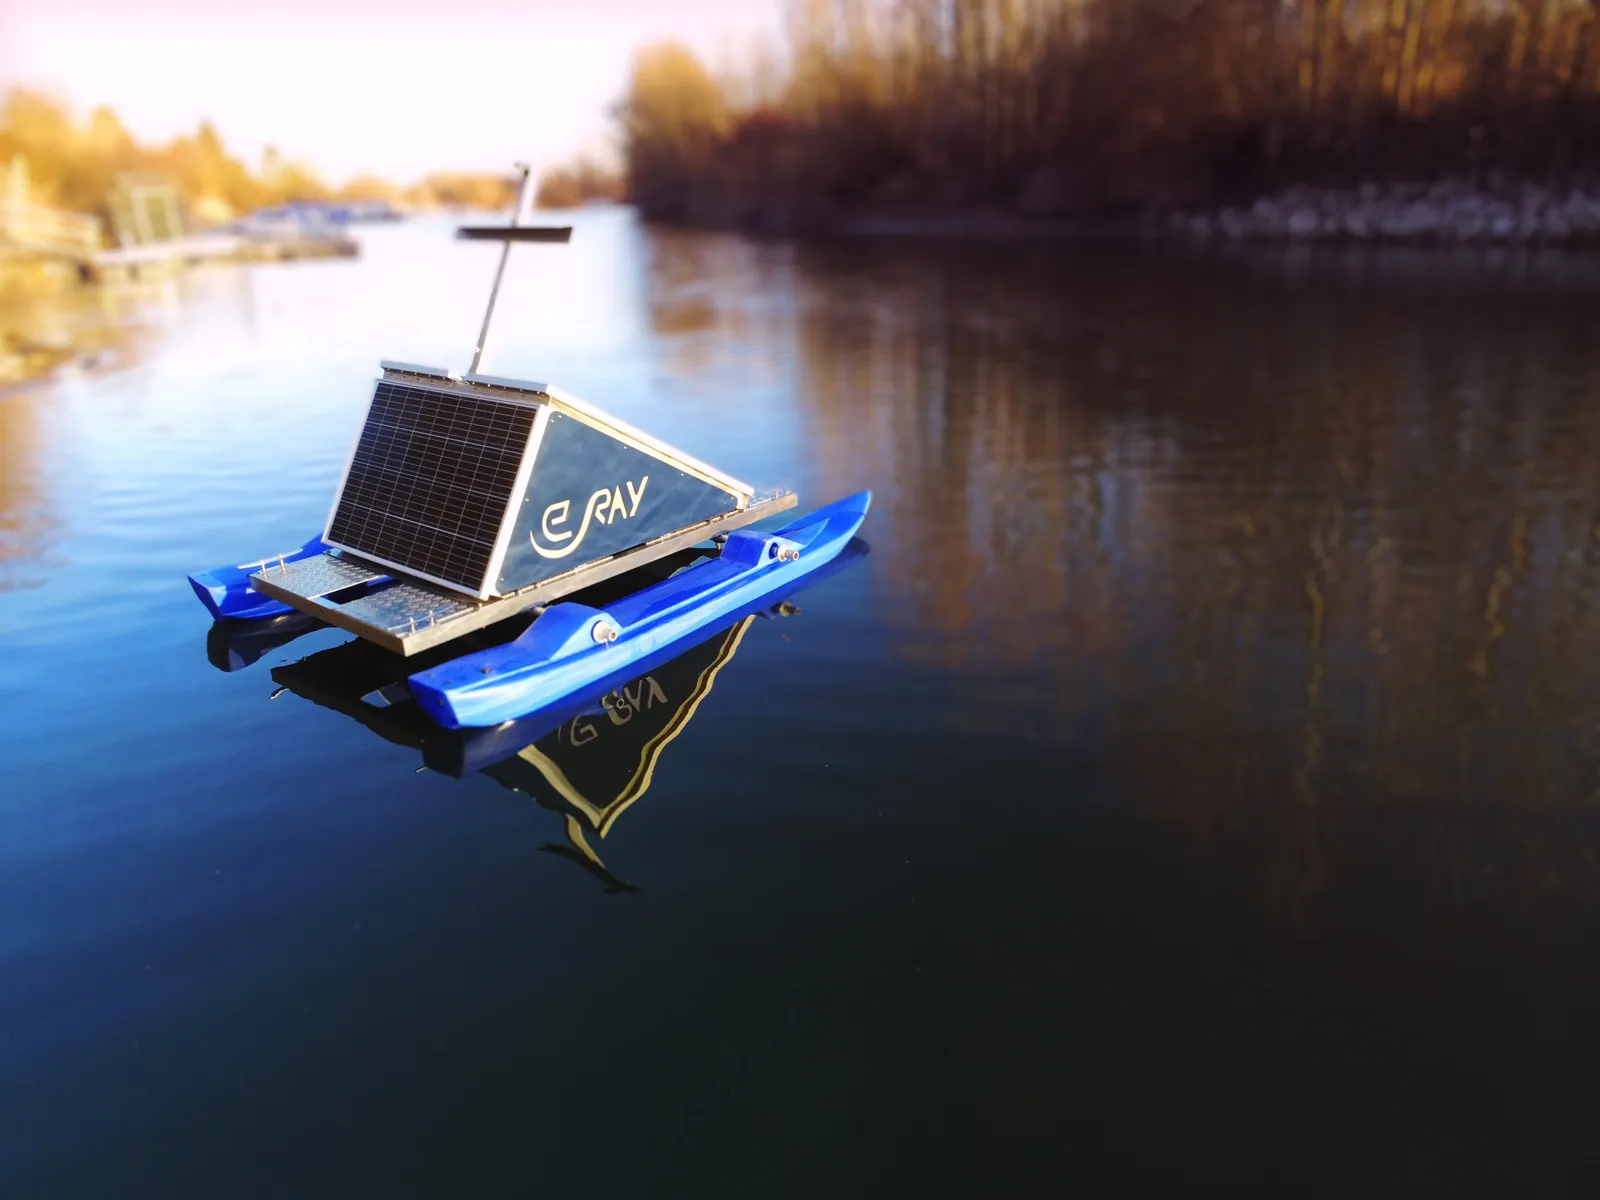
Pontoon variant for deep lakes, shore-fixed point for rivers, mobile version for campaign use. Deployment typically in one day – retrieval possible at any time.
Multi-site view, roles & permissions, alert management, hosted in Frankfurt.
GeoJSON, WMS, SQL drop, REST API. Your existing GIS remains the source of truth.
Corrosion-resistant, fauna-neutral.
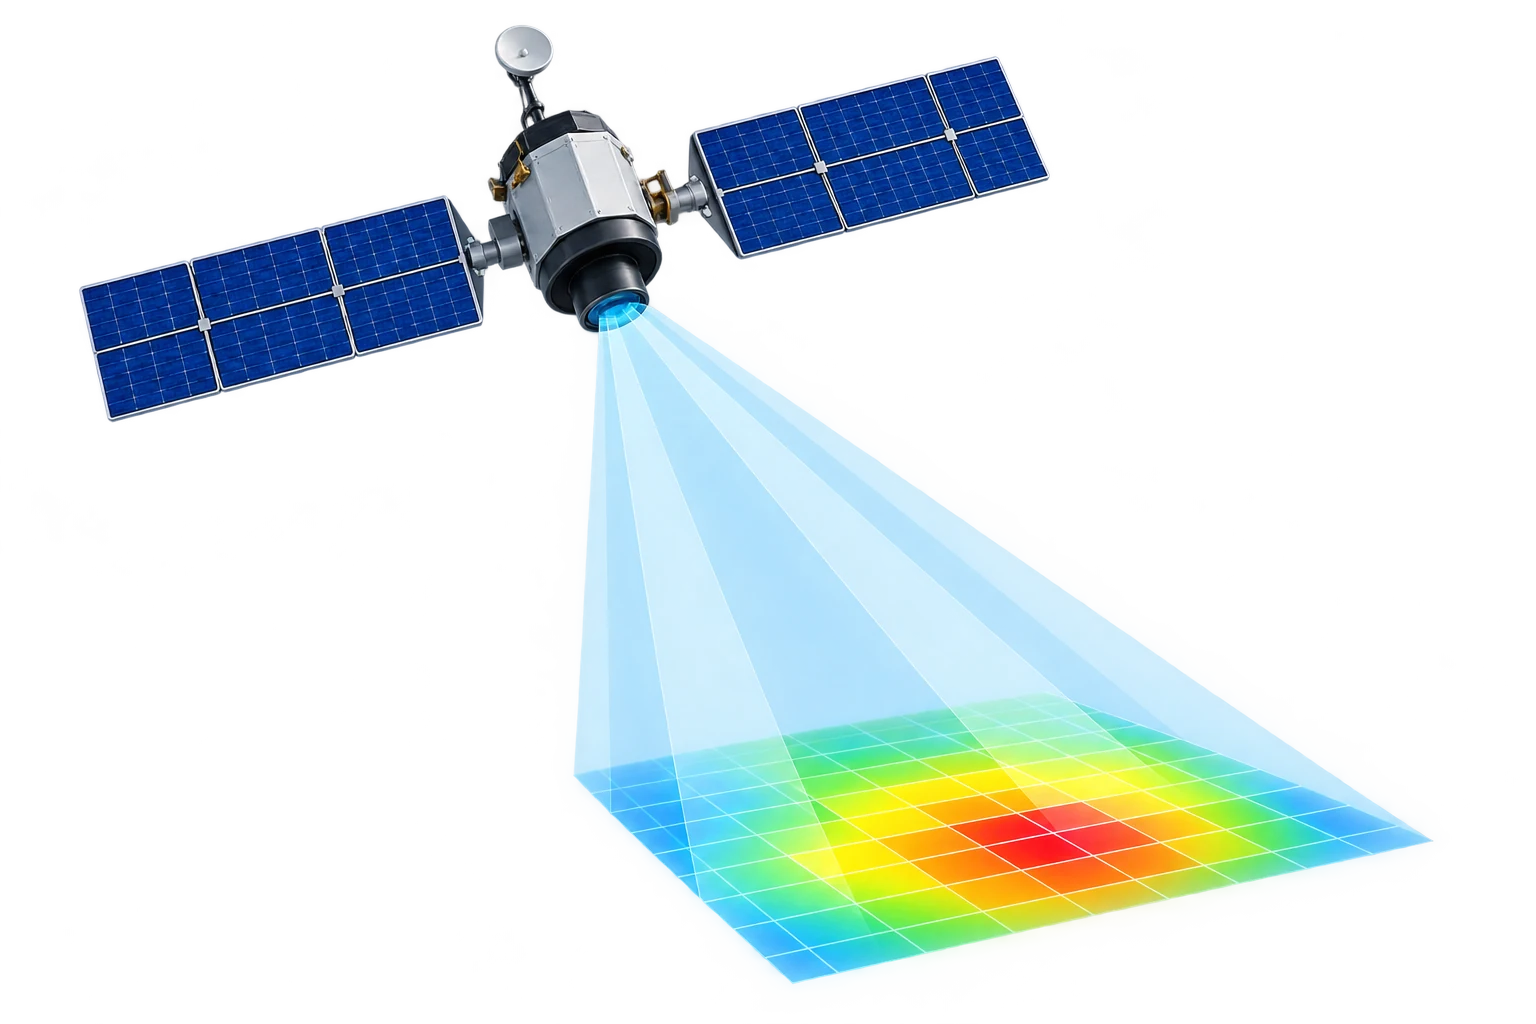
SWIM analyses satellite data from the EU Copernicus programme and makes the condition of water bodies visible across entire areas – including where no station is installed, and retrospectively over decades.
Explore SWIM →RTL Hessen · 3 May 2022
Television report on the pilot project at the Großer Woog, published on the e.Ray channel.
Also on television ARD Nordmagazin: Badeseen: Überwachung der Wasserqualität mit neuer Sensorik ↗ 17 April 2025
Request a demo unit, download the data sheet or arrange a consultation.
WAMO continuously captures the core parameters: temperature, oxygen, pH, conductivity, turbidity, chlorophyll and phycocyanin (cyanobacteria marker). The platform is manufacturer-open: sensors come from established professional manufacturers such as s::can/Badger Meter, Endress+Hauser or bbe moldaenke, optionally YSI and OTT, not in-house builds.
Solar-self-sufficient, in continuous operation. The platform floats anchored on the water; the solar panel feeds battery and sensors – no shore power connection required. Maintenance intervals: 3–6 months depending on the water body.
Via LTE/mobile in 1- to 15-minute intervals straight to SWIM. There it is available as a live dashboard, as an API for third parties (e.g. Smart City platforms) and as a data export.
WAMO detects rising phycocyanin and chlorophyll values and compares them against stored thresholds and trend models. On exceedance, an SMS or email warning goes to the responsible parties.
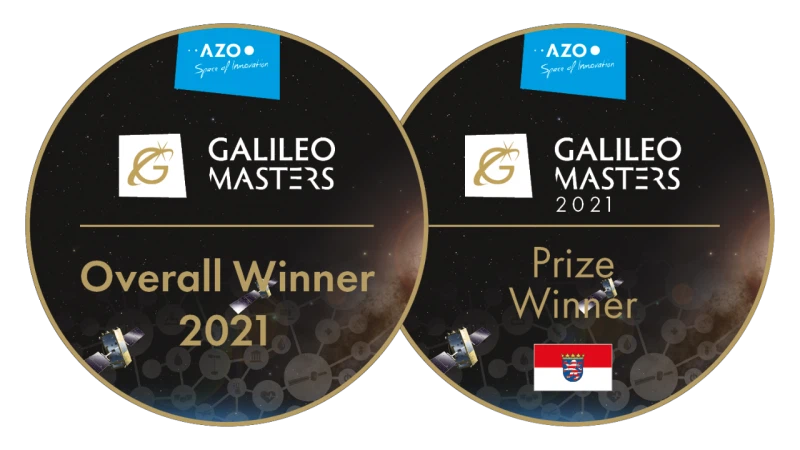
WAMO is a recipient of the EU Seal of Excellence and 2021 Galileo Masters winner. Pilots are funded via the Hesse Ministry for Digital Strategy (Distral) and EU programmes such as Horizon Europe, among others. We advise on the right funding line.
Standard delivery 6–10 weeks. On-site setup is completed within a day – anchoring, deployment, cloud connection and sensor calibration.


