Blue-green algae & water quality
A blue-green algae bloom is visible by the time a closure is already due. Sensors in the water and satellite analysis show the increase before it can be seen with the naked eye – time in which a decision to close or to give the all-clear can still be prepared.
Visible algae or toxicity lead to closures. WAMO readings and satellite proxies produce QC-assessed trends – early enough to act.
Blue-green algae usually only become visible once a closure is already necessary.
Grab samples show snapshots, not a trend.
Closure decisions have to be justifiable to the public and to the supervisory authority.
Today, fewer than 0.1 % of all water bodies are monitored in real time.
Current practice: manual sampling every 4–6 weeks during the main season, and in winter usually no monitoring at all. In Hesse, for example, there are hundreds of standing water bodies, of which only 65 are EU bathing waters subject to sporadic grab samples – and 180 gauges in total.
The new pressures: climate change and agriculture generate loading patterns that the sampling frequency of the 1970s can no longer capture. Heavy rainfall washes nutrients into the water. Oxygen-poor sediments release phosphorus. Cyanobacteria produce methane during the day as well – and in oxic layers too.
The consequence: anyone who wants to manage water bodies today needs time series, not grab samples. Early warning, not a diagnosis of the past. After all, sound monitoring is the basis for effective measures – working across whole areas is what produces the knowledge of where and when supporting measures in the water body genuinely help.
The trend, not the single reading
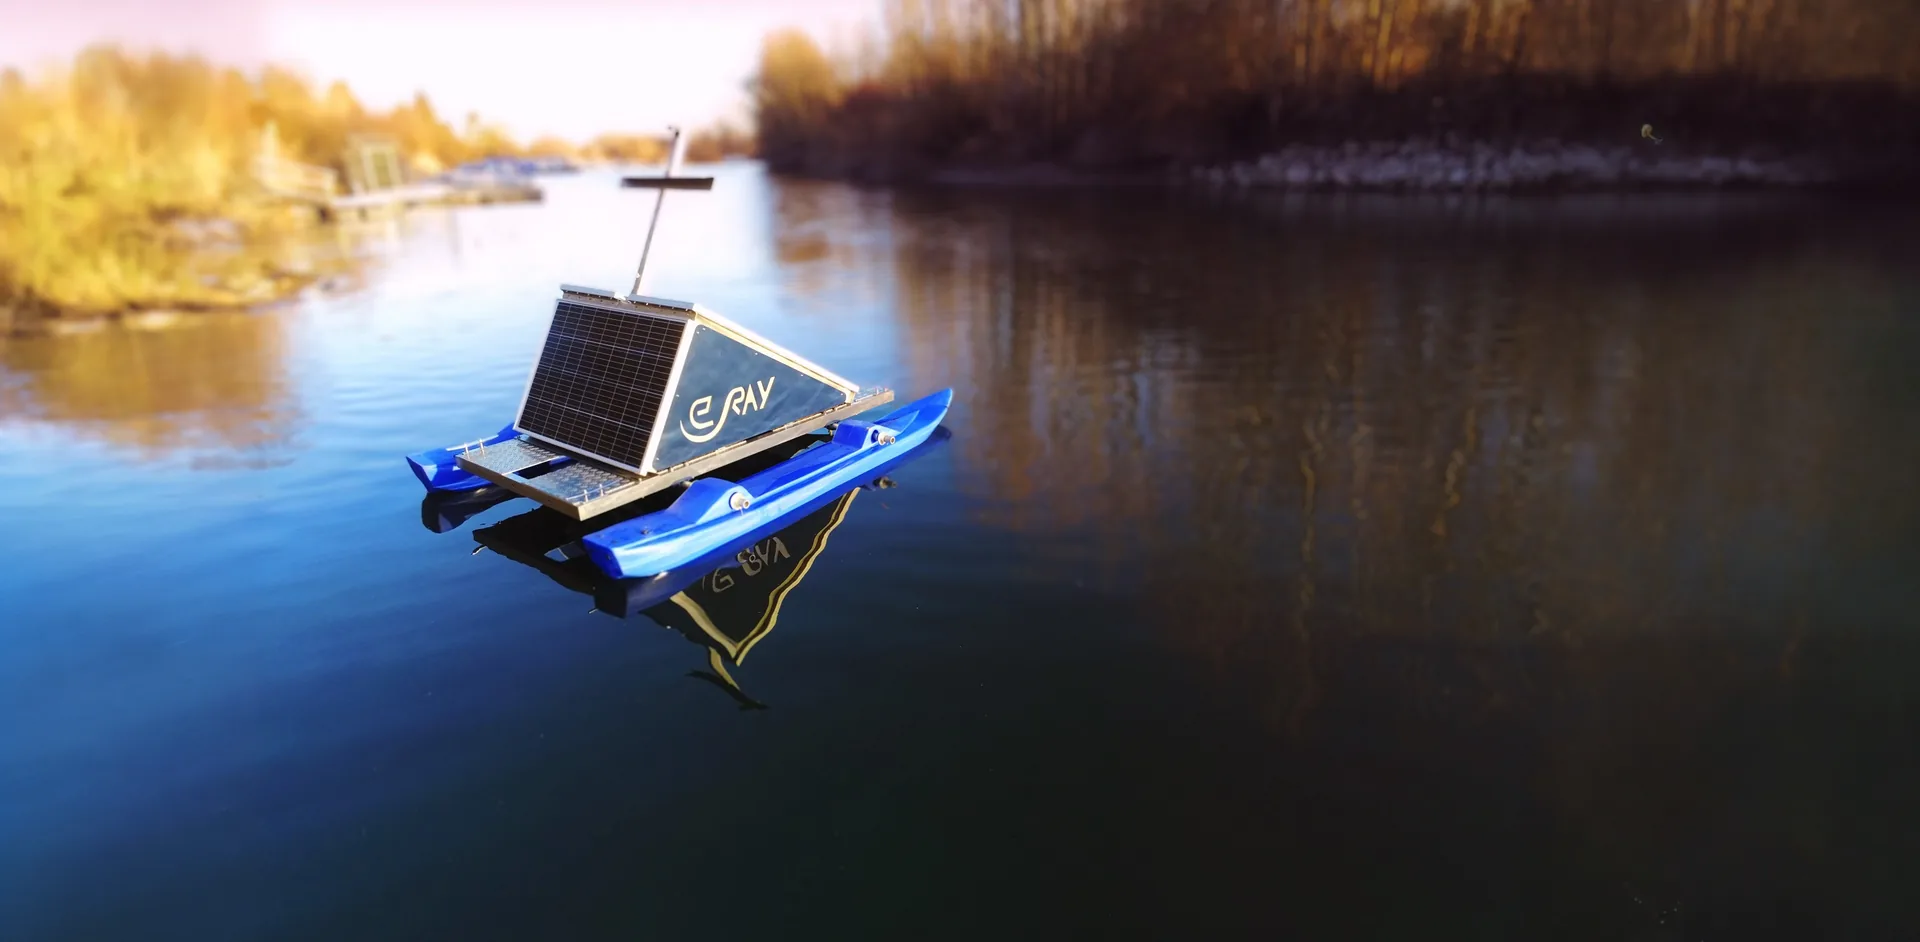
WAMO measures continuously on site; SWIM delivers area-wide satellite proxies. Together they produce QC-assessed trends that make a decision to close or to give the all-clear defensible.
Measure
Continuous readings on site, at short intervals instead of at single points in time.
Contextualise
Satellite proxies place the readings in their spatial context.
Decide
Justify a closure or an all-clear on the basis of the verified trend.
20 WAMOs in area monitoring
Mecklenburg Lake District
Area-wide monitoring across many lakes: the same sensors, the same evaluation, one shared data set for everyone involved.

Gewässergüte-Messstation schwimmt auf dem Tollensesee
neueins Regionalfernsehen · 23 August 2024
Report by the Neubrandenburg regional broadcaster on the first WAMO station in Tollensesee.
Also on television ARD Nordmagazin: Badeseen: Überwachung der Wasserqualität mit neuer Sensorik ↗ 17 April 2025
Frequently asked questions
Which parameters does WAMO record?
Temperature, oxygen, pH, conductivity, turbidity, chlorophyll and phycocyanin – simultaneously and continuously. The exact sensor configuration depends on the water body.
Does this replace official sampling?
It complements it: continuous trends between the samples, so that you can act earlier and with evidence.
How quickly do I see an anomaly?
At intervals of 1 to 15 minutes. As soon as a reading exceeds the stored threshold, the warning goes out.
