
Time series & trends
Every parameter as a time series – daily, weekly and seasonal trends at a glance instead of individual spot readings.

The WAMO Dashboard is the analysis interface of the e.Ray network: every station sends its readings straight into the browser – at Lake Babenhausen, the readings of the full sensor set arrive in parallel. Time series, export and map turn raw data into a situational picture that decisions can be based on.
Every WAMO station transmits its current readings to the dashboard. The overview shows the most recently transmitted value and its unit for each parameter.
Snapshot from ongoing operation. The parameter set is configured per station.

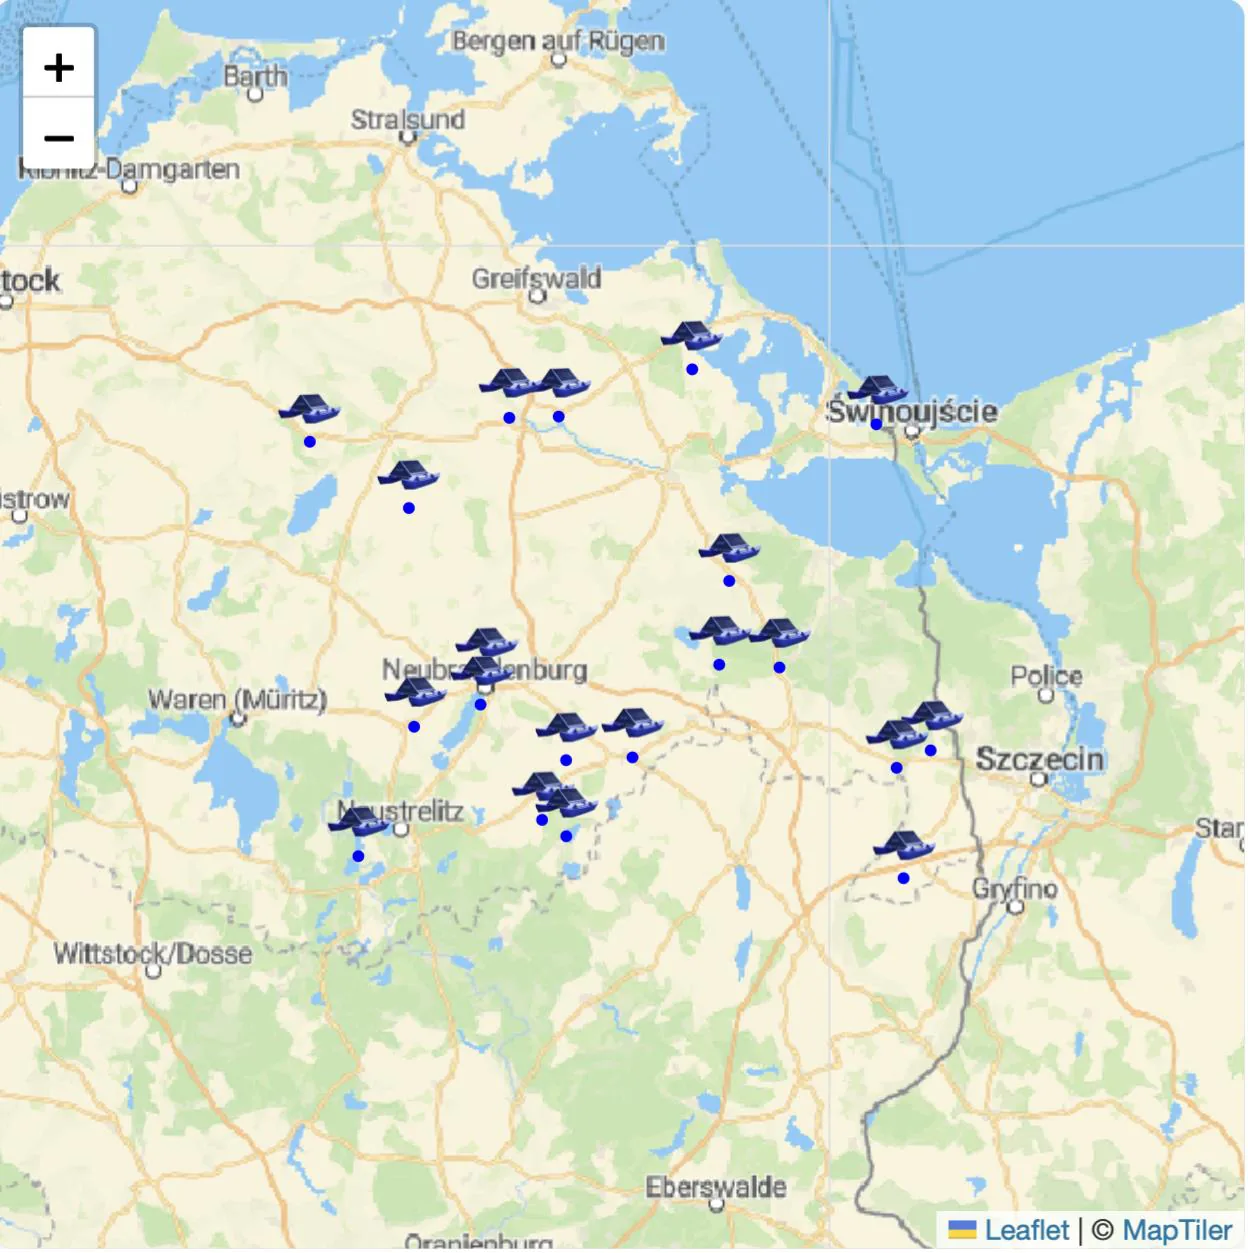
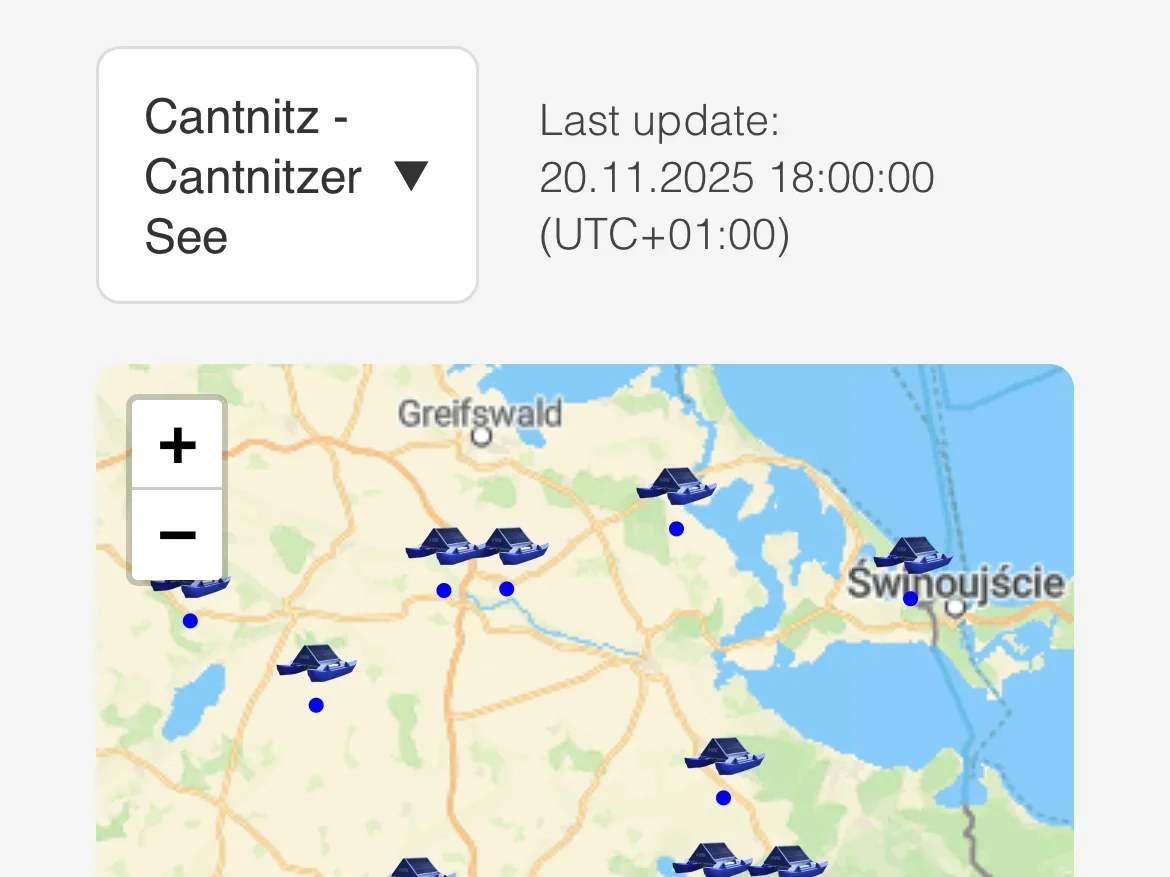
Views from live operation 2025/2026. We will add time series and export views once they have been approved.
Every parameter as a time series – daily, weekly and seasonal trends at a glance instead of individual spot readings.
All raw data as CSV for reports, expert assessments and your own analyses – with no detours.
All stations on one map – status and current readings for each site.
Readings as an API for third-party systems, for example Smart City platforms.
Cities, districts and public authorities already hold a great deal of water data today: monitoring programmes, gauge and weather series, satellite imagery, specialist registers, biological surveys. Data is rarely what is lacking. More often what is missing is the place where it comes together, becomes comparable and answers a concrete question.
We do not replace existing systems. Your specialist application, your register and your monitoring programmes stay exactly where they are. We connect the existing information where it is worth more together than separately.
Monitoring programmes of the federal states, specialist registers, open portals. They describe the framework: classification, history, management objectives.
WAMO stations measure continuously on site. The sensor configuration follows the question at hand, not a fixed package.
Area-wide analyses show changes across the entire water body and reach back into archives that begin before the first station.
Gauge, discharge, precipitation, catchment, water-body structure, water balance and the results of biological surveys put the measured values into context.
Official data supplies the context: classification, history, legal framework. Your own measurements supply the current condition in the water body. Only both together produce a considerably more complete picture – one that carries an assessment and justifies a measure, instead of forcing you to reconcile two worlds of data in your head.
Genetic methods such as eDNA and metabarcoding could derive species lists from a few litres of water where laborious fish surveys and manual identification are required today. Imaging methods could recognise organisms automatically and follow their development over years. Our concern is not to line up as many technologies as possible, but to add the layer that suits the question at hand.
Status: under review. eDNA, metabarcoding and imaging methods are not part of today's range of services.
On this basis we are developing our data and analysis platform further: viewing different water data in one place, following developments over longer periods, making information available more quickly for planning, assessment and water management. SWIM, our satellite-based analysis with its own dashboard, gives a first insight into this path.
View SWIM →Our vision is deliberately long-term: an ever better understanding of our water bodies from many individual data sources. Not all at once, but step by step.


