Layer 01
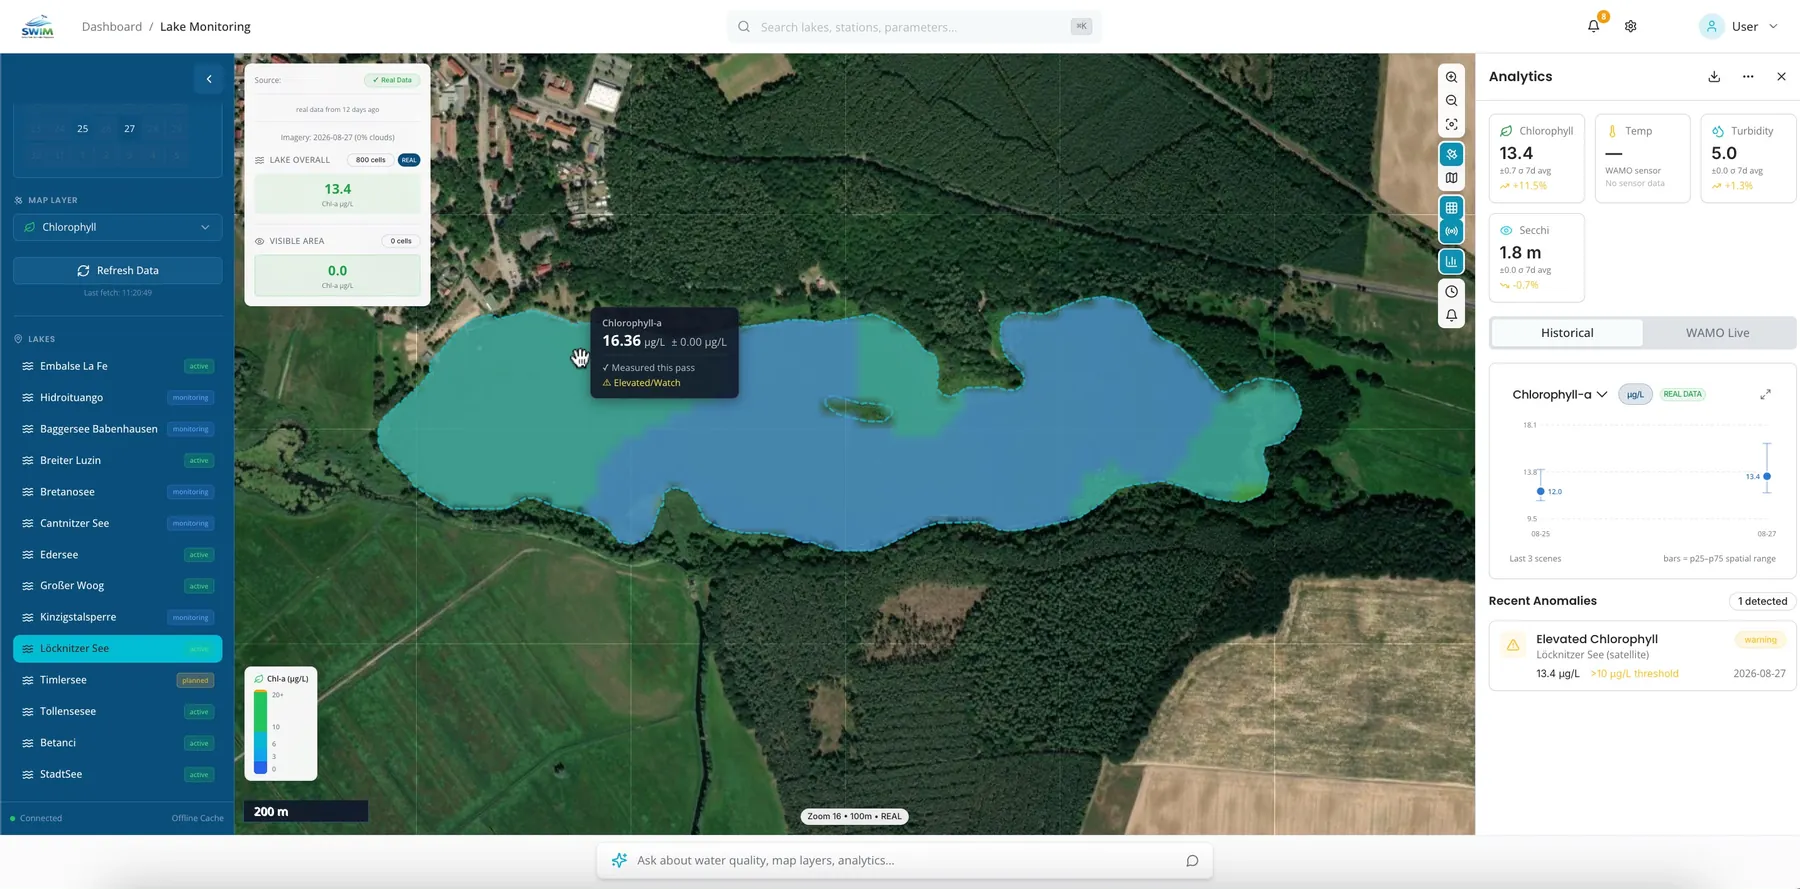
Chlorophyll heat-map
Algal concentration as a wide-area overview of the entire water body.


SWIM is the software in the e.Ray network: satellite-supported water-body analysis for entire regions, with no installation on site. Where no measurement station is anchored, SWIM delivers area-wide condition data and a historical look back through the Sentinel archive – developed with support from ESA and EUSPA.
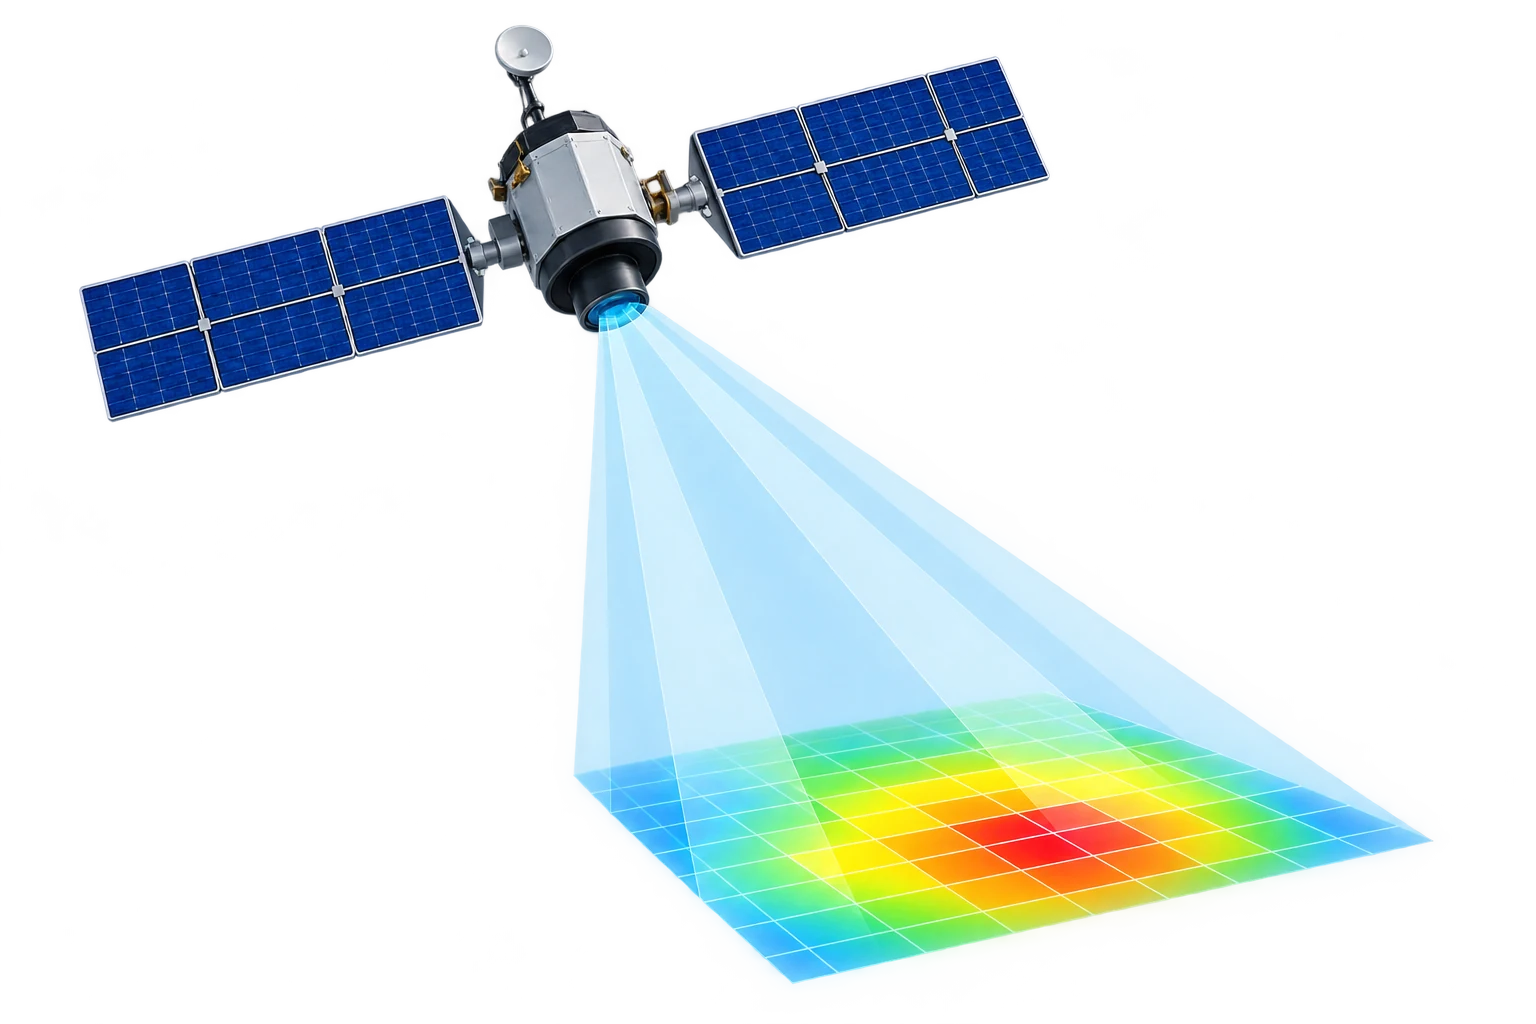
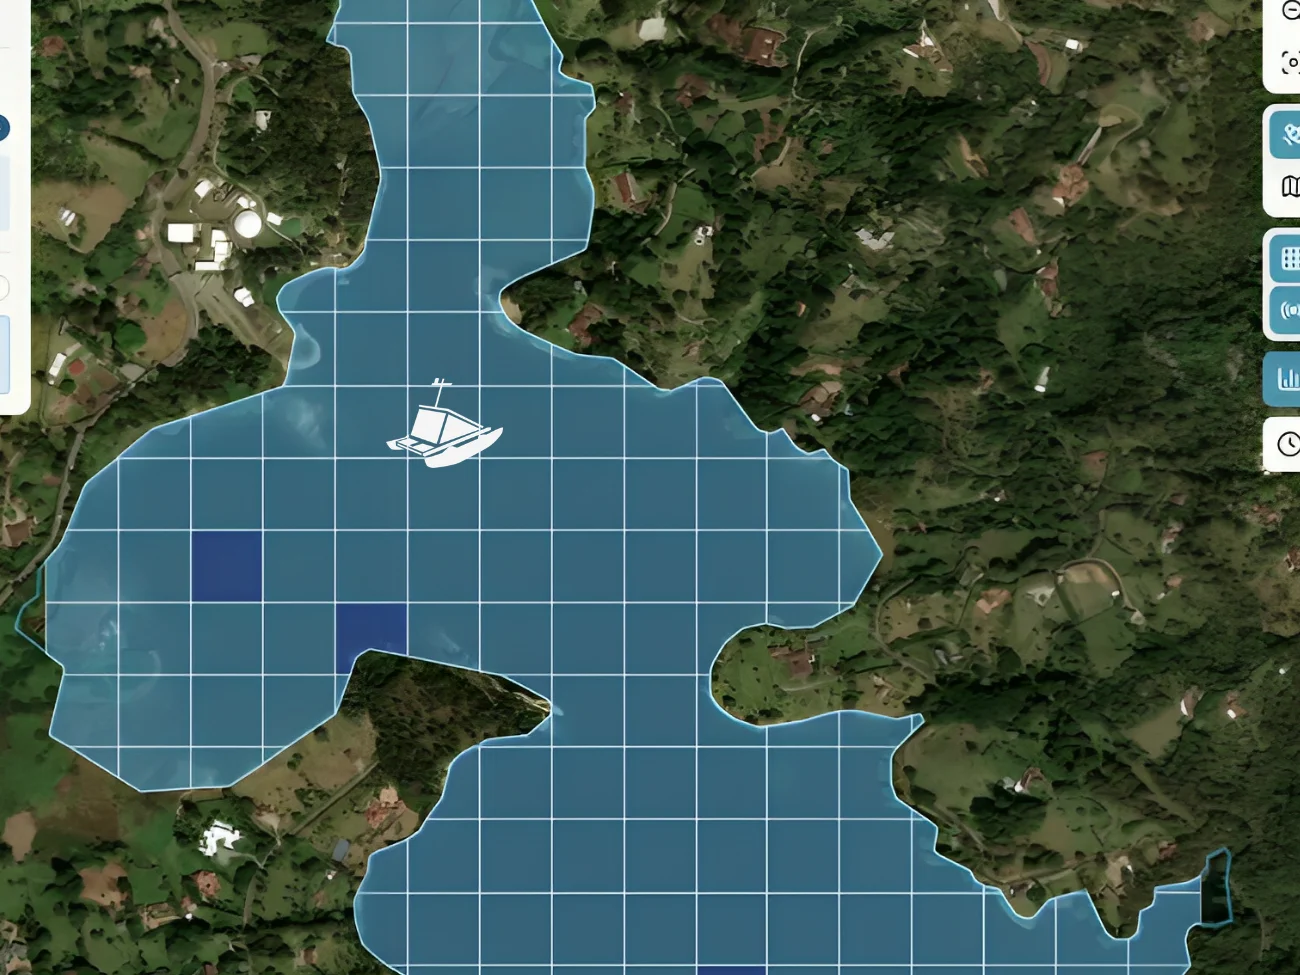
SWIM is designed as a satellite-based platform for regional multi-water-body monitoring – weekly water-quality data, automatic algae-risk classification and historical baselines from the Sentinel archive. We will add a specific case study as soon as official approval is in.
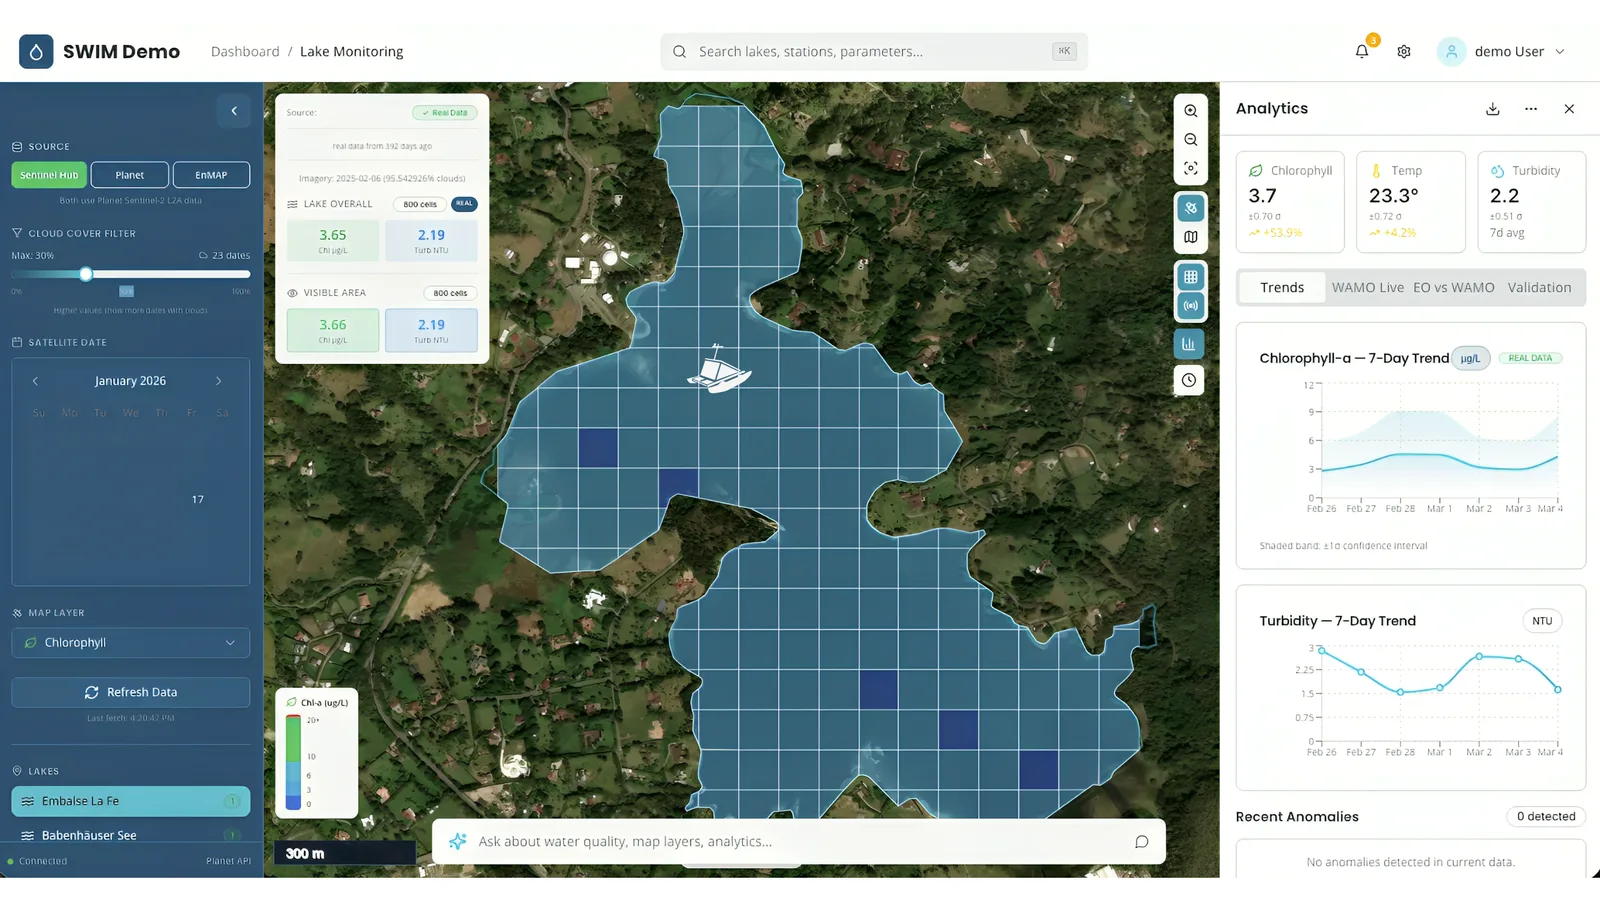
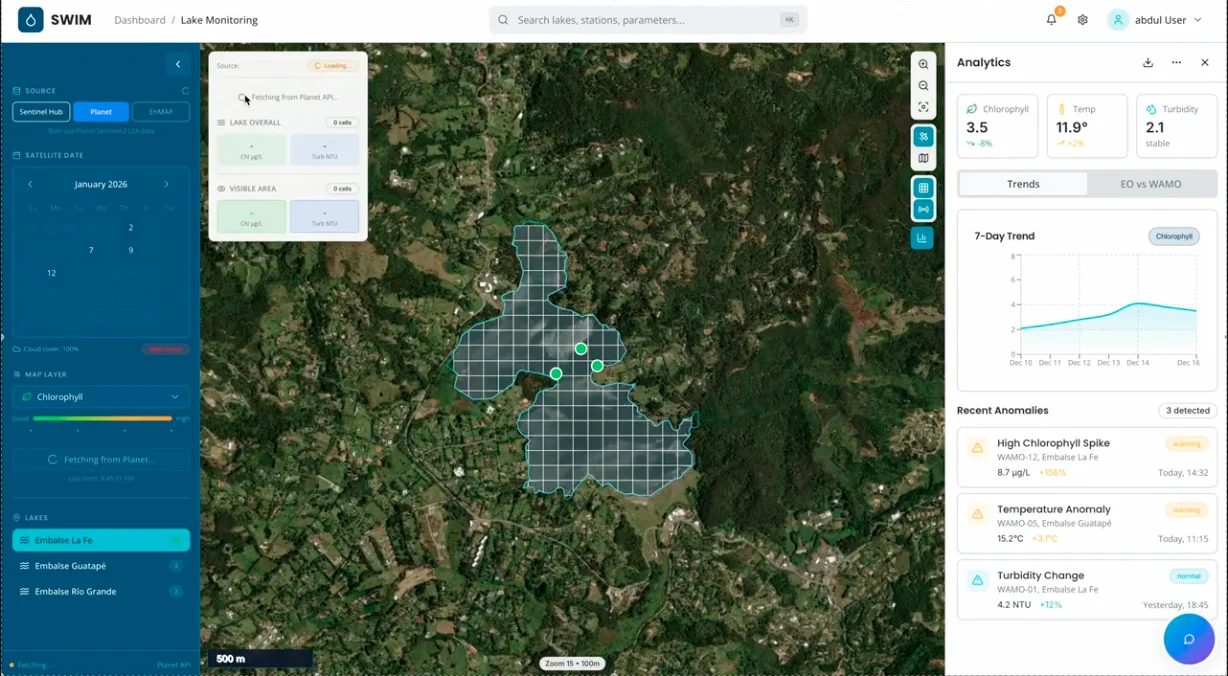
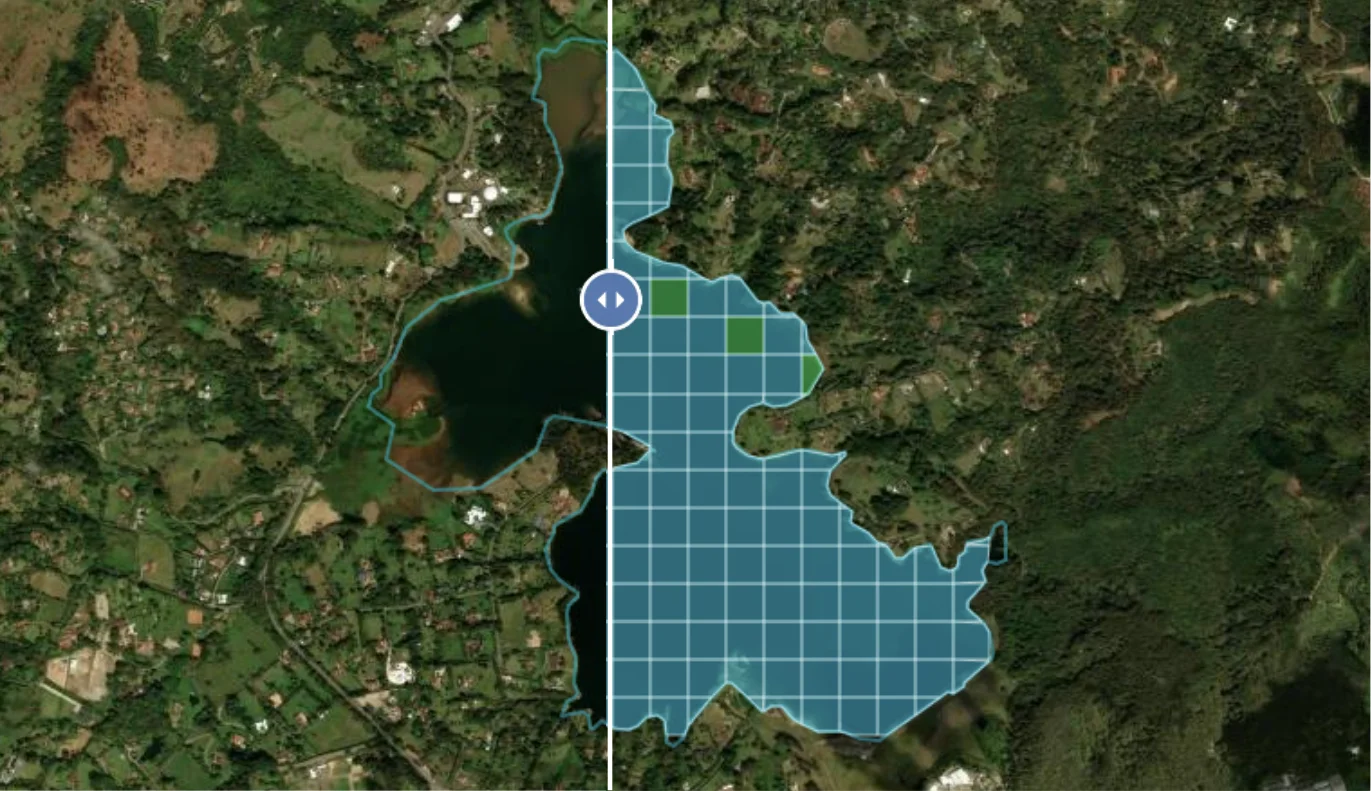
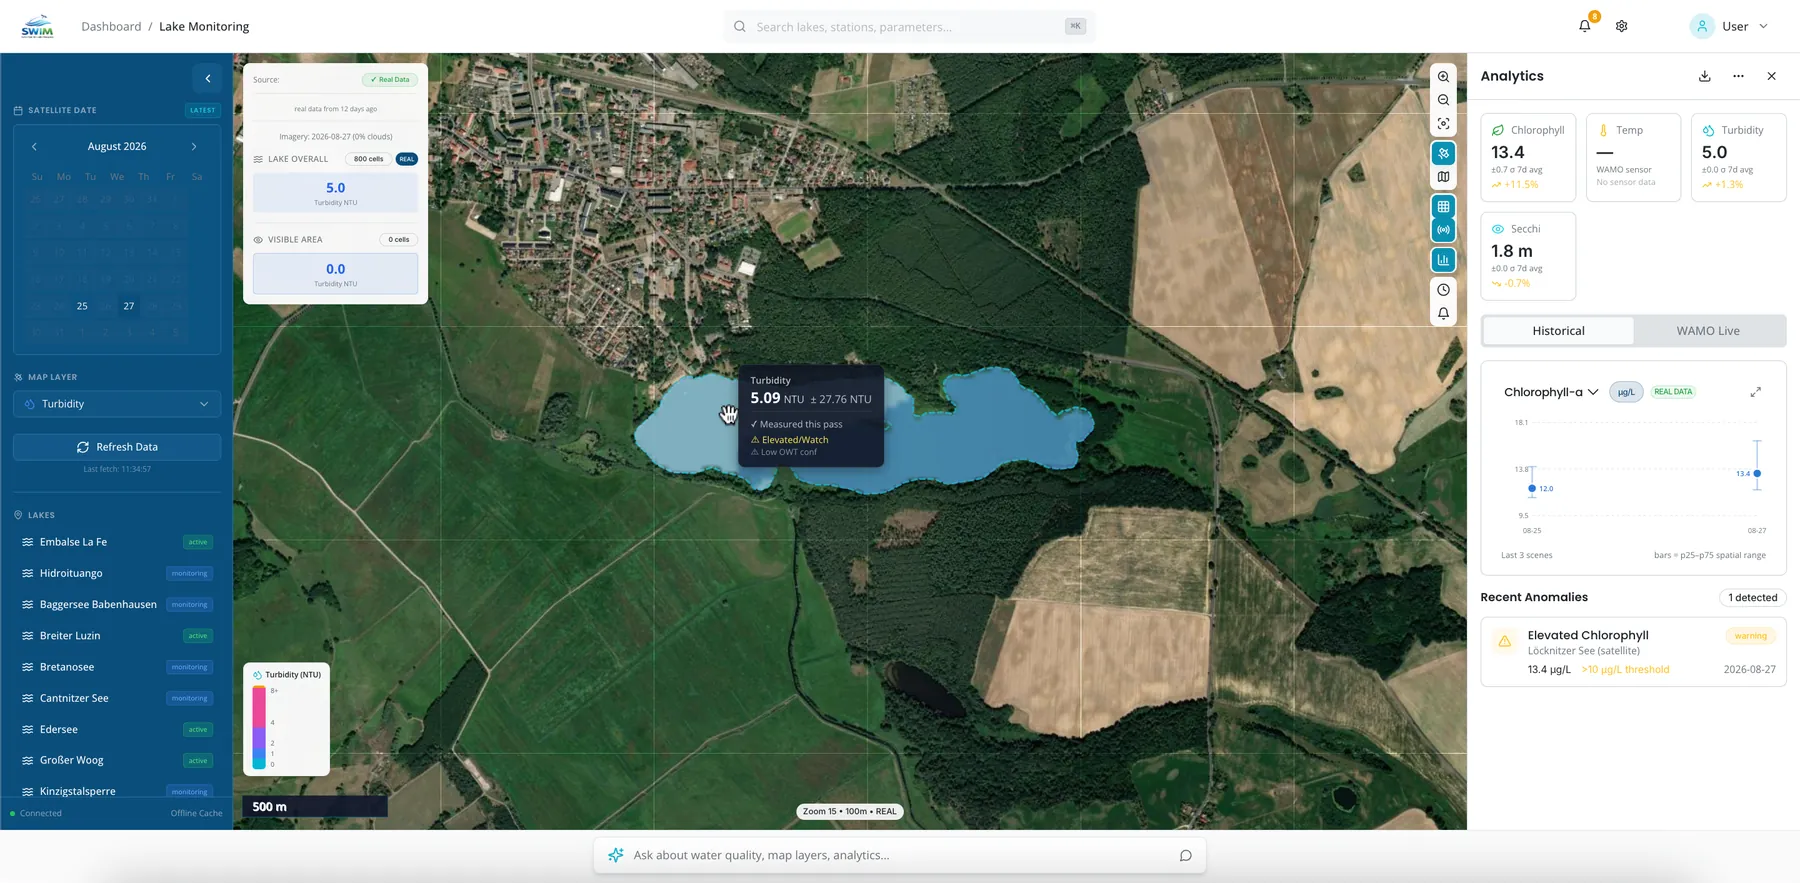
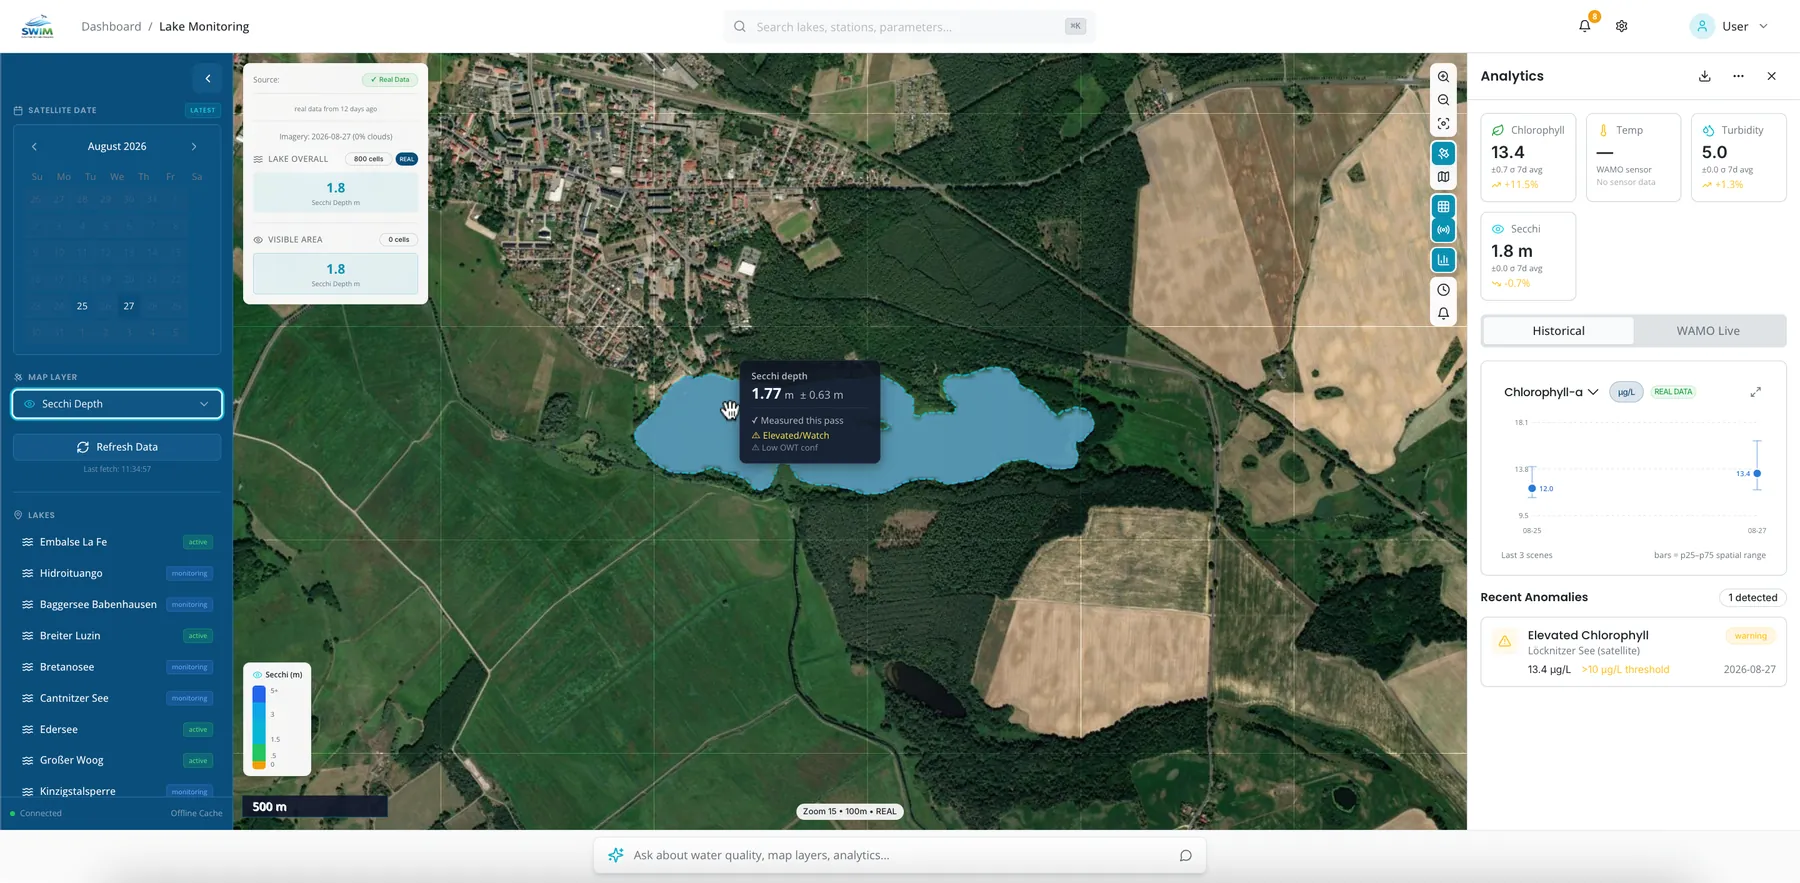
The film works its way through the interface: selecting a satellite source, reading the raster map, checking time series and comparing them with the readings from the water.
Eight heterogeneous data sources, grouped into four source types – in-situ, satellite, model, manual. Click a data source to open the detail text.
Hundreds of water bodies at once – without field campaigns.
Access to historical data for robust trend analyses.
Automatic detection of algal blooms and anomalies.
Export to GeoJSON, Shapefile, WMS.
Automatic notification on critical thresholds.
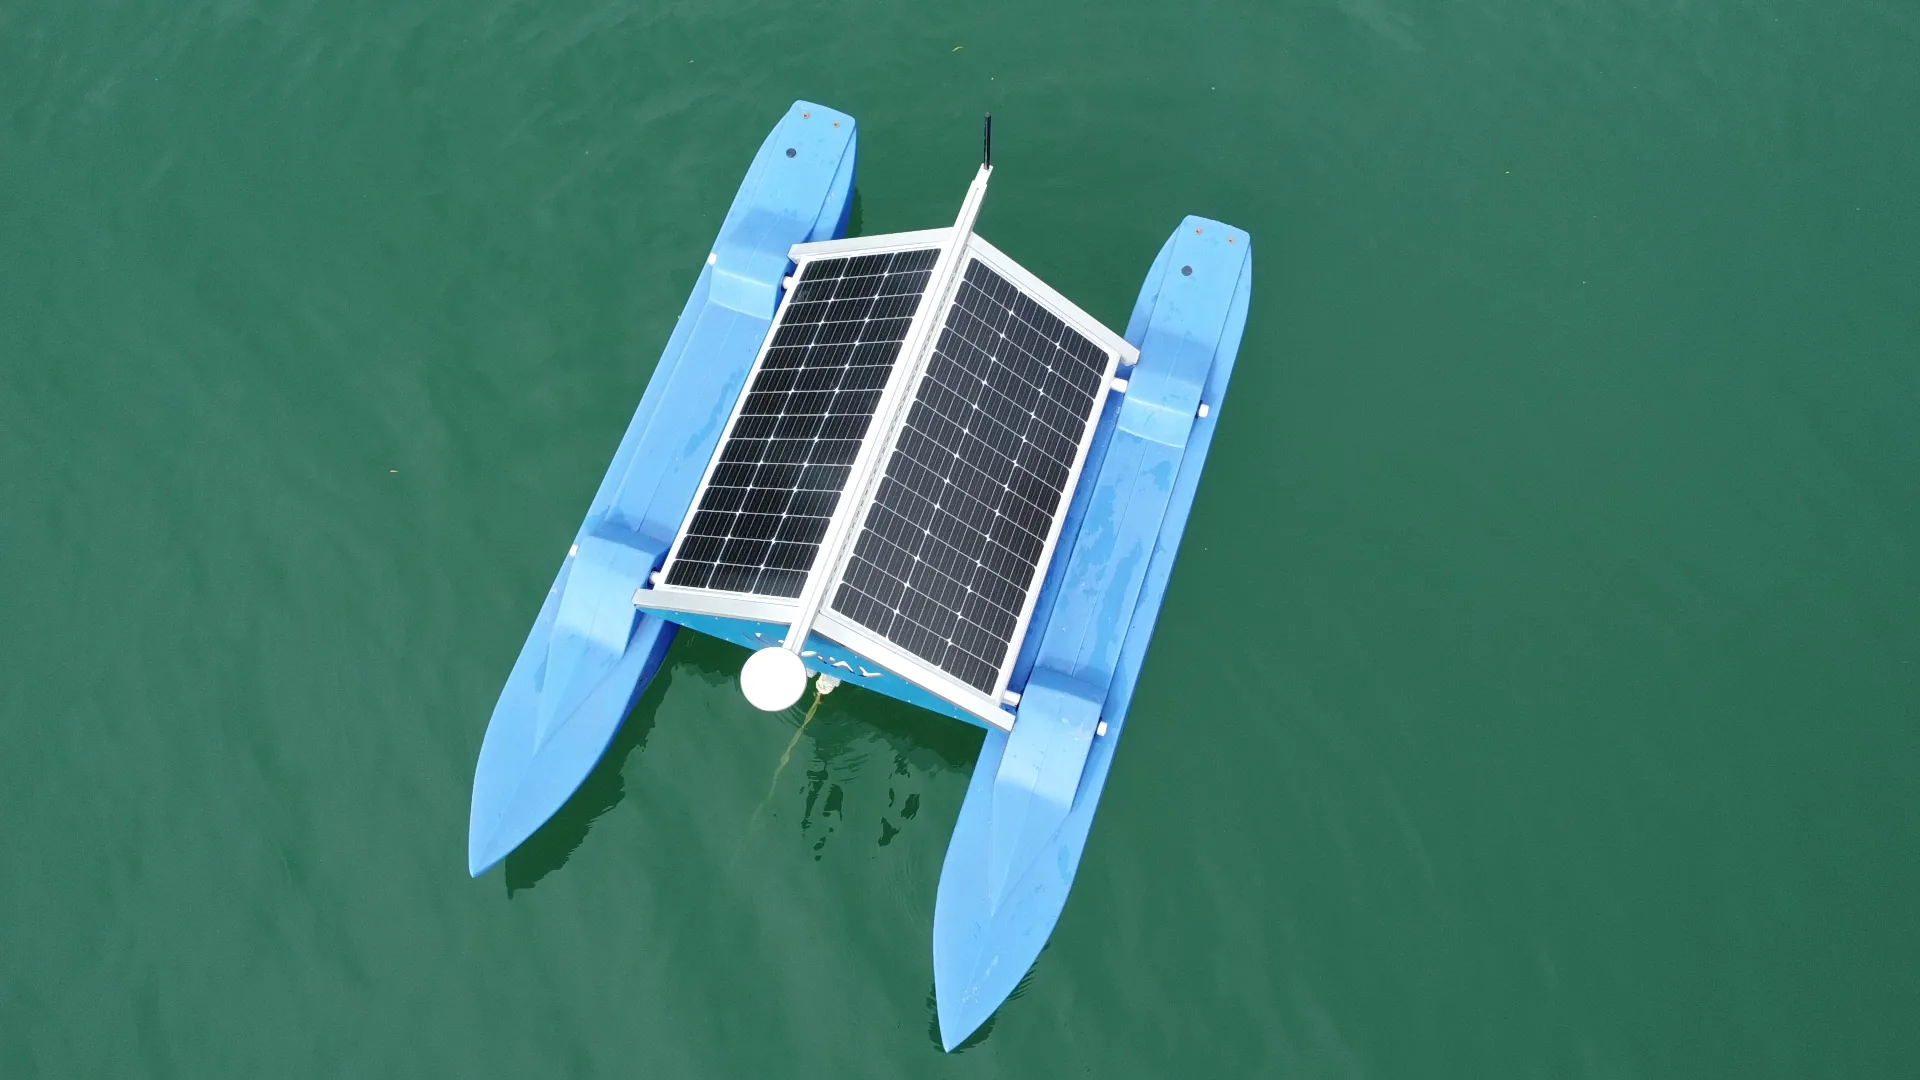
Calibrated with WAMO ground data: highest accuracy.
SWIM is a satellite-supported remote-monitoring platform for inland waters. We analyse Sentinel-2 data from ESA / Copernicus and Landsat data from NASA / USGS, derive layers for Secchi depth, algal concentration, turbidity and chlorophyll – and provide weekly maps for entire catchments.
Spatial 10–30 m per pixel (depending on satellite sensor), temporal 3–10 days per update. More than sufficient for trend analyses and hotspot detection – well complemented by point-precise WAMO stations.
Standing and slow-flowing waters from approximately 5 ha of water surface. SWIM is in use at pilot sites in Mecklenburg-Vorpommern and Latin America.
Via the SWIM dashboard in the browser, as WMS/WMTS layers in GIS systems (QGIS, ArcGIS), as an API for Smart City platforms, or as a data export for reporting obligations.
The first analysis for your catchment is free of charge. We deliver a sample map and a report covering the last 12 months of your water body – as a basis for the decision on continuous operation.